How to check your network bandwidth usage on linux
How to check your network bandwidth usage on linux
Today I’m going to write about network bandwidth usage. For network provider like ISPs or datacenters, network bandwidth usage is one of the things you need to keep track from time to time. I’m saying this because while this is fairly cheap now days, if an attack is being received or being sent from one of your systems in your network, depending on the scale of the attack this can cost you a lot. In this article I’m going to let you know how you can in real time check your network bandwidth usage using one of the simple software IPTraf.
Why do we need to be wary about this anyway since bandwidth is cheap?
Indeed bandwidth is cheap, your ISP or datacenters will charge you probably on per Mbps around 4-7 USD (or less) and you will probably use with a web server and a normal website at most 10 Mbps, that’s about 1MB of constant upload/download. A normal website will not reach this amount. Anyway, this is pretty cheap, having a website or websites that has such amount of traffic should allow you to monetize some of your website traffic and to at least get back the server cost including collocation and still remain with some amount. The reason why you need to monitor bandwidth usage is for cases when you receive an attack to your server, most ISPs or datacenters will make you pay with the 95th percentile method, so that you will have 5% in a month (almost a day) to use your bandwidth without any limit. This means if you do receive an attack and it is caught in time, it will probably not cost you that much if you are in that 5% limit.
Also there are a few softwares that can help you monitor your server resources over a period of time and also give you some nice graphs for easy interpretation, what I’ve used so far and liked are:
These two offer you detailed graphs for a more period of time, currently I’m also using hobbit, for one of my servers. Ok, back to our main topic, the first thing you need is to install IPTraf if you don’t have it already, normally you should have this installed by default. Using yum or apt, depending on the distribution you use, you can install iptraf.
- For Debian, ubuntu based installations
|
1 |
apt-get install iptraf |
- For Centos, Redhat, Fedora
|
1 |
yum install iptraf |
Next just view the screen, and follow the steps bellow to see how you can see your bandwidth usage in real time.
1. We start by running command iptraf
|
1 |
iptraf |
2. Next you will see a screen with some information about the IPTraf application, press any key here to continue.
3. You will see a new window with some options, I usually select the General interface statistics or Detail interface statistics
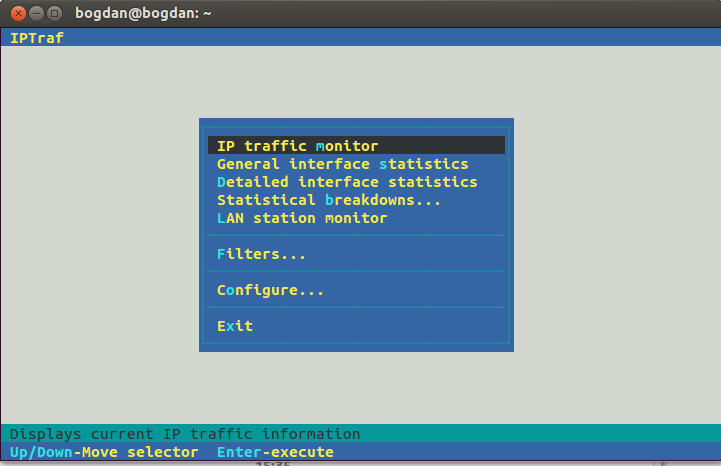
Main IPTraf window
In case you select the Detailed interface statistics, you will need to also choose the network interface (in my case eth0) to monitor.
The result should be similar to the image bellow:
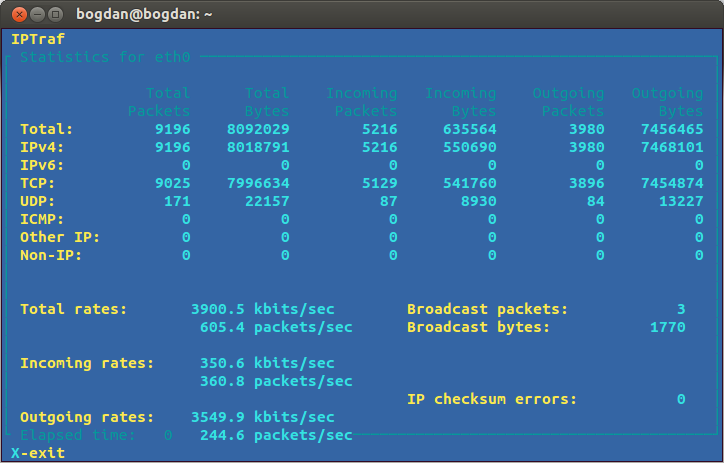
Detail information IPTraf
Analyzing the results from the monitor
You will probably see similar information as the one above, what I’m mostly using is at the
- Total rates
- Incoming rates
- Outgoing rates
As you probably guessed, the outgoing is the amount of packets/data that goes out of your server, Webservers normally have similar result where the outgoing is higher then the incoming. In the event of an attack, the incoming rates will be much much higher and that point you will be needing to be alerted. I already said in another article about how I got a slight increase of 1Mbps that was incoming and was continuously incoming for a few hours, using iptraf and hobbit is how I noticed the incoming and here is how I sniffed the network traffic to see from where it was coming in.


