Website speed test and website performance review
Website speed test and website performance review
Everyone knows about the famous speedtest.net tester, if not, do check it out! So what of it? Well similar to how you test your internet connection speed, you can check your websites page speed and receive a report based on on each online tool features that are provided. I’m going to focus my attention on 4 major tools that I found really good, each with its perks and benefits, and mainly:
- Webpagetest.org
- GTMetrix.com
- Google Pagespeed
- Pingdom
Now the order are mainly based on how I believed at the current time are most benefit, but this is just personal opinion, so no hard feelings please. Also while I use Pingdom a lot for my testings, I have added it to the bottom since it doesn’t offer a lot of suggestions on what it needs fixed / improved, however it does to the job really well.
I will however start from the bottom, normally I would go with the first one, but just for each and everyone of you to properly see what I mean by ‘in detail’ analysis. So lets just start with Pingodm.
Pingdom Website Speed Test
You can see in the right image, the result of the test would show a score named “performance grade”, the number of requests that were downloaded from your site, the time needed to load the page and the page actual size(this is important).
I did mentioned in one my articles before, but a visitor *normally* will not spend more then 3-5 seconds for a page to open, he will be annoyed of the waiting time and he will bounce of the page. So, what it is that we are looking for more exactly? In the Quick report it will show us a few important information about the tests and also about the page, namely:
- The number of requests that needed to be downloaded from the specific website. You should try to lower these as much as possible, if you have images, try combining them in sprites and serving just one whole image for the entire website. If not possible, try to reduce their size by minify the resources or compress them using gzip or any external software.
- Load time, the actual time needed to fully load all resources on the website tested. This is usually where almost everyone look, so nothing really to say about it, except for the 3-5 seconds page load which I was referring earlier.
- Last, but not least, its the page actual size, this is also something you should keep in mind, a bigger page size will obviously have a bigger load time. So if possible try splitting your pages to reduce the page size where possible.
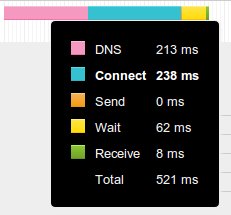
Another feature I liked here is when you view the resources in cascade and you go over with your mouse, a tooltip will appears with some specific information related to the connection. I’m more looking at the first download resource, the html page (browser only download html content, even if the page is written in php) and checking if the connection to the website is proper. In the image on the right side you will see what I mean exactly.
So yeah, what am I actually looking here? This is actually something that I got fixed for me recently, I had some problems with my cache plugin on wordpress, basically I had the wait time with over 500-900 ms for a simple (believed at first) html cached page. The wait time is the time the web server needs to handle the request for you, so in my case, each time it tried to create a new cache page, but it failed/timeout or whatever error it was, and I was left with a wait time higher then normal. Now as you can see, have a 62ms wait time.
The rest are normally dependent on your network provider (including DNS server) and distance to your Webserver. So if you are looking to reduce the other values, you should consider getting a hosting provider that is much closer to your location.
And now for the fun stuff, the performance grade, page analysis and history review (this one is what like here).
The performance grade
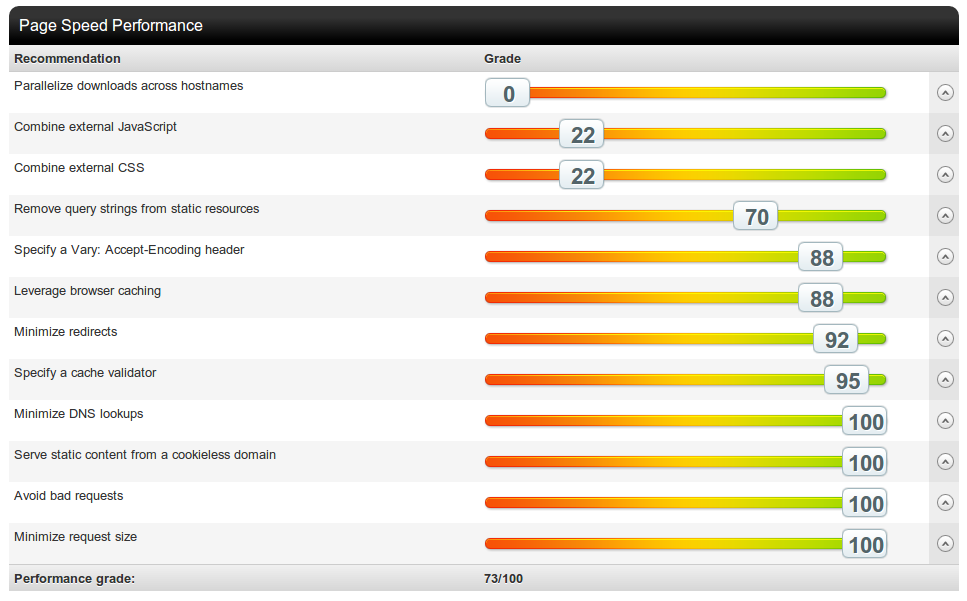
As the name implies, it gives you a score on each resources and advises you what you should improve.
I’m not really going to go in too much detail in explaining these, some of them are straight forward. What I will say, is that it does show exactly what I had in plan in optimizing more on my site, mainly in trying to combine stylesheets and reducing the number of download resources even more.
Page Analysis
In this section you will find a more details report on your webpage, this includes:
- Server response
- Page analysis
- Size analysis
- Requests analysis
History
This feature is something I mainly like, it lets me look back at how my website has actually improved or not. It will keep track on history page load, page size and request count and also page speed score.
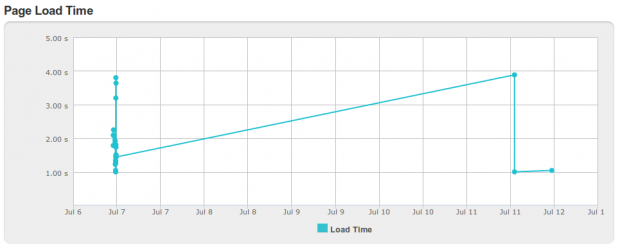
What I’m always looking is the first one, page load history:
As you can see, it had some issues at some point this month and then it got drastically fixed, I mentioned this already that I had my cache plugin fixed as it wasn’t caching any pages.
So this is all about Pingdom, next is Google pagespeed.


